
Welcome back to my FREE Reselling as a Business Mini Course! I hope that you enjoyed week 1 of my mini course and I thank you for coming back to join me for week 2! This week, we will be talking about the importance of tracking your data. Specifically, we will explore the value in tracking your data and how to interpret your data to make future business decisions. Before we get into it, I just wanted remind you that if you missed last week’s discussion, you can check it out HERE. Now that that’s out of the way, let’s get into this week’s topic, Tracking and Interpreting Your Data!
Week 2: Tracking and Interpreting Your Data
In this section of the course, we will be discussing 2 topics related to data collection:
The Importance of Tracking and Interpreting Data
How to Track Your Data
How to Interpret Your Data
A) Why Do I Need to Track and Interpret My Reselling Data?
When I first started reselling back in 2013, tracking data was the furthest thing from my mind. As a hobby reseller at the time, I just wanted to get rid of some of my unused item and make a quick buck. Years later, when I switched to part-time reselling, I realized that I needed to start tracking more of my activities for both tax purposes and inventory selection. Now, as a full-time reseller, I track EVERYTHING that I do. Why? Because there is so much useful information that comes from tracking and interpreting your data. This data helps you to see what business practices are working and which ones may need some tweaking. It also helps you to understand what items are in-demand and selling at any given moment, to predict future consumer trends, and to make better purchasing decisions.
Unfortunately, this step is often overlooked by many newer resellers. I regularly speak with newer sellers and almost all, if not all of them never bring up data tracking and interpreting. They typically focus all of their time and energy on the “fun” part of reselling (aka sourcing for inventory). While that is obviously important, I personally believe that inventory selection should be based on data and consumer trends. If people are actively looking for it, then it will sell; it really is that simple. Although data collection and interpretation may not be deemed the “fun” part of reselling, it definitely is the most important part of the equation when it comes to making you sales (and money!)
B) How to Track Your Data
When it comes to tracking data, many reselling platforms now have tools to make this process easier for you. Poshmark and Mercari, which are my two main reselling platforms, actually have sales reports with helpful data that you can download and save. Within these reports, I am able to see what items sold, how long it took them to sell, what my profits were per item and per month, where items sold geographically, and what categories of items are currently selling (and that’s just to name a few). Tracking data is now really easy to do so there is no excuse to not use these free and helpful tools.
In case you are not familiar with how you can find and download these reports, let me show you how to locate them on both the Poshmark and Mercari apps.
The Free Poshmark Sales Report and Inventory Report:
To locate the free Poshmark Sales Report, be sure that you are logged into your Poshmark account via the app on your phone. The report can only be requested via the Poshmark phone app. Once the report has been requested, it will be sent to the email address linked to your Poshmark account. From there, you can open it for free via Google Sheets or through a paid subscription of Microsoft Excel.
To access it on your phone, open the Poshmark app.
Click on the icon above your closet name on the bottom right bar. It should bring you to a menu where you will find your My Seller Tools.
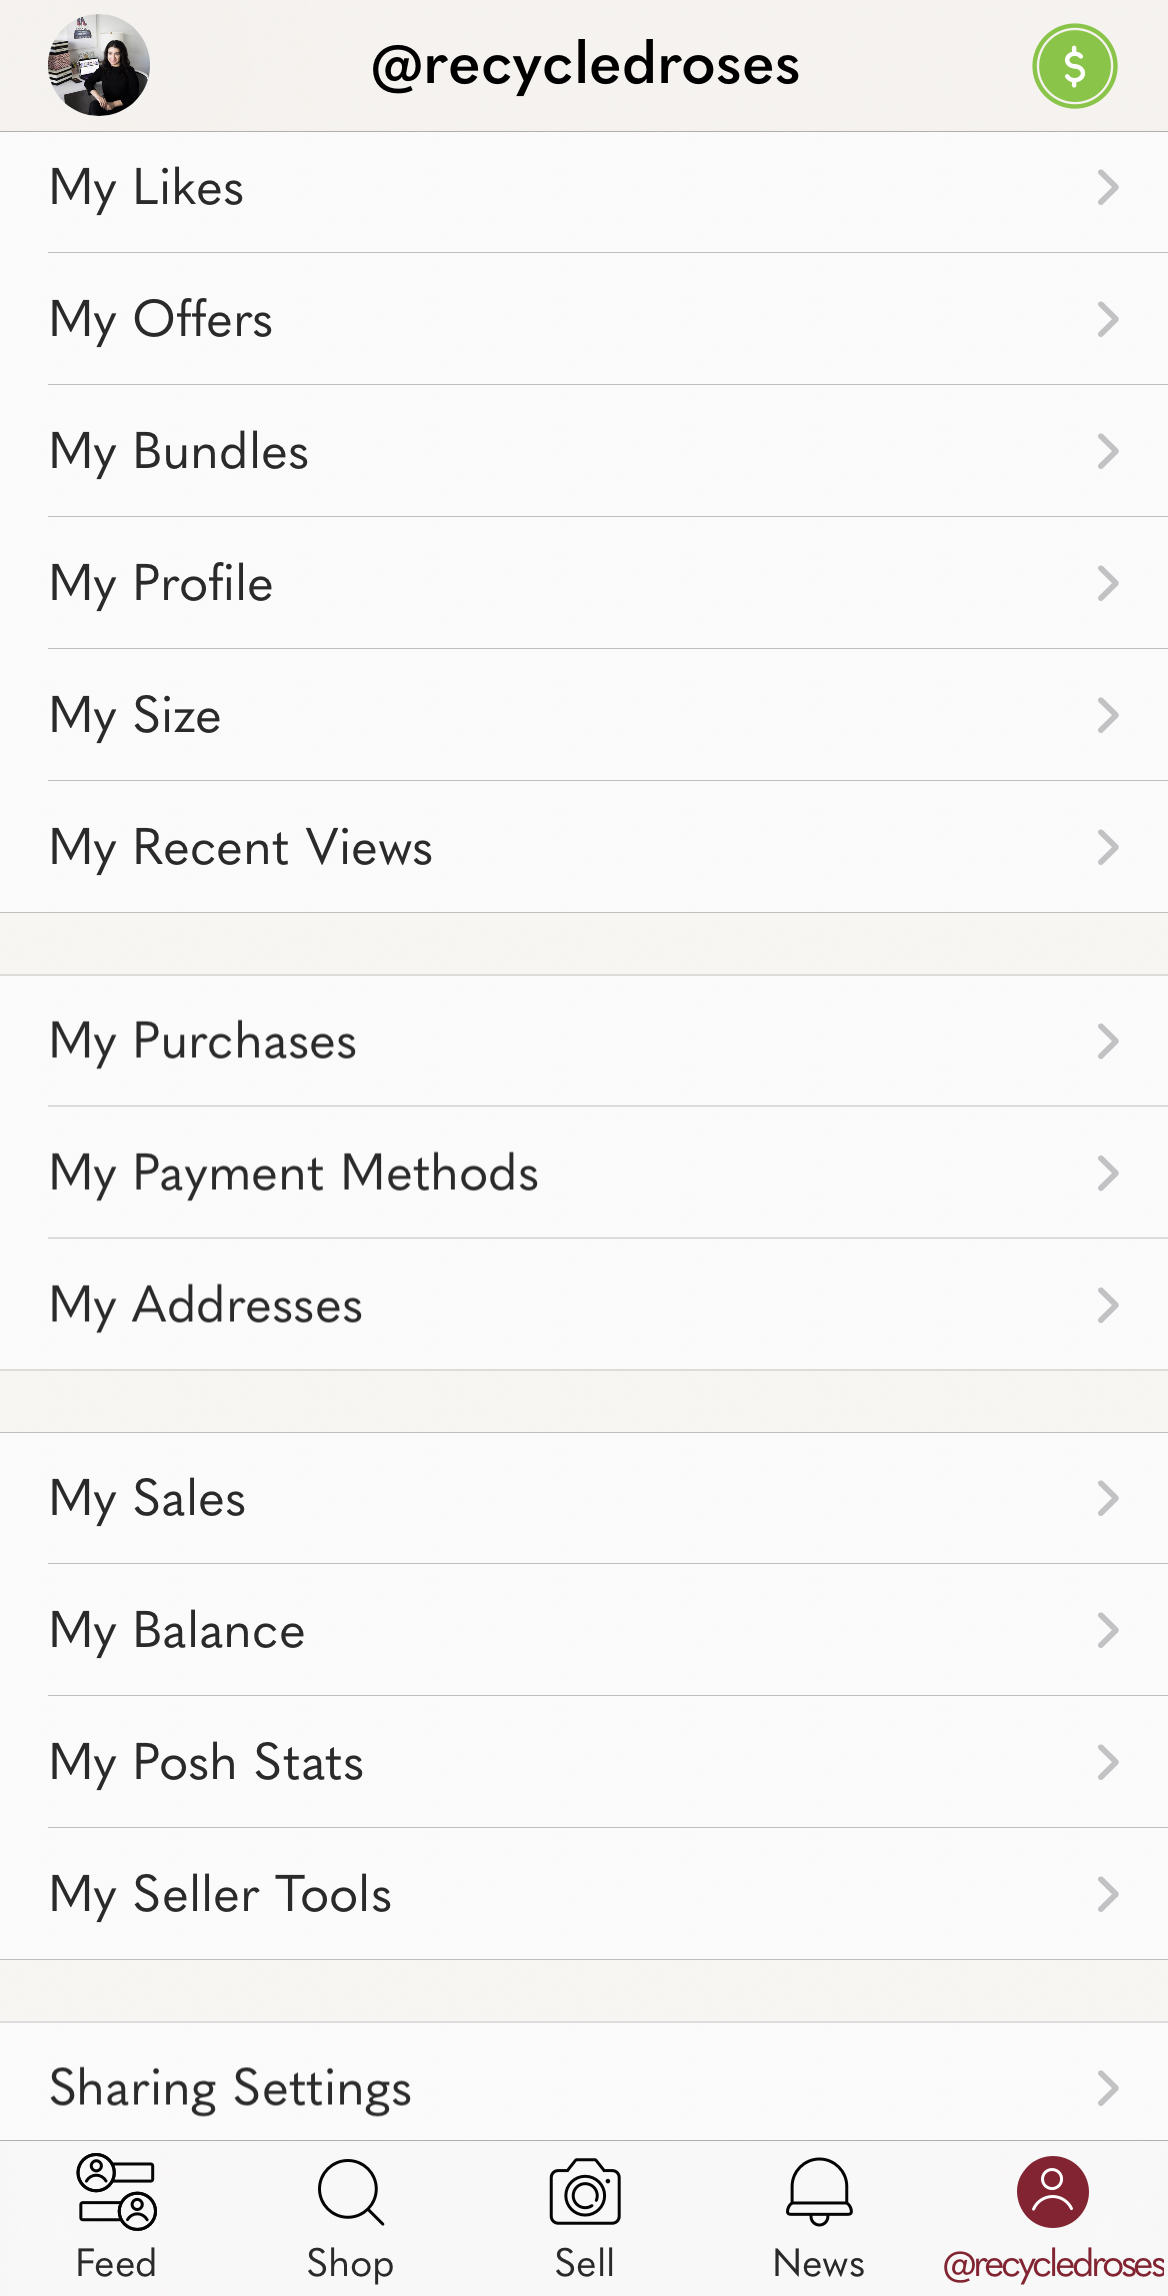
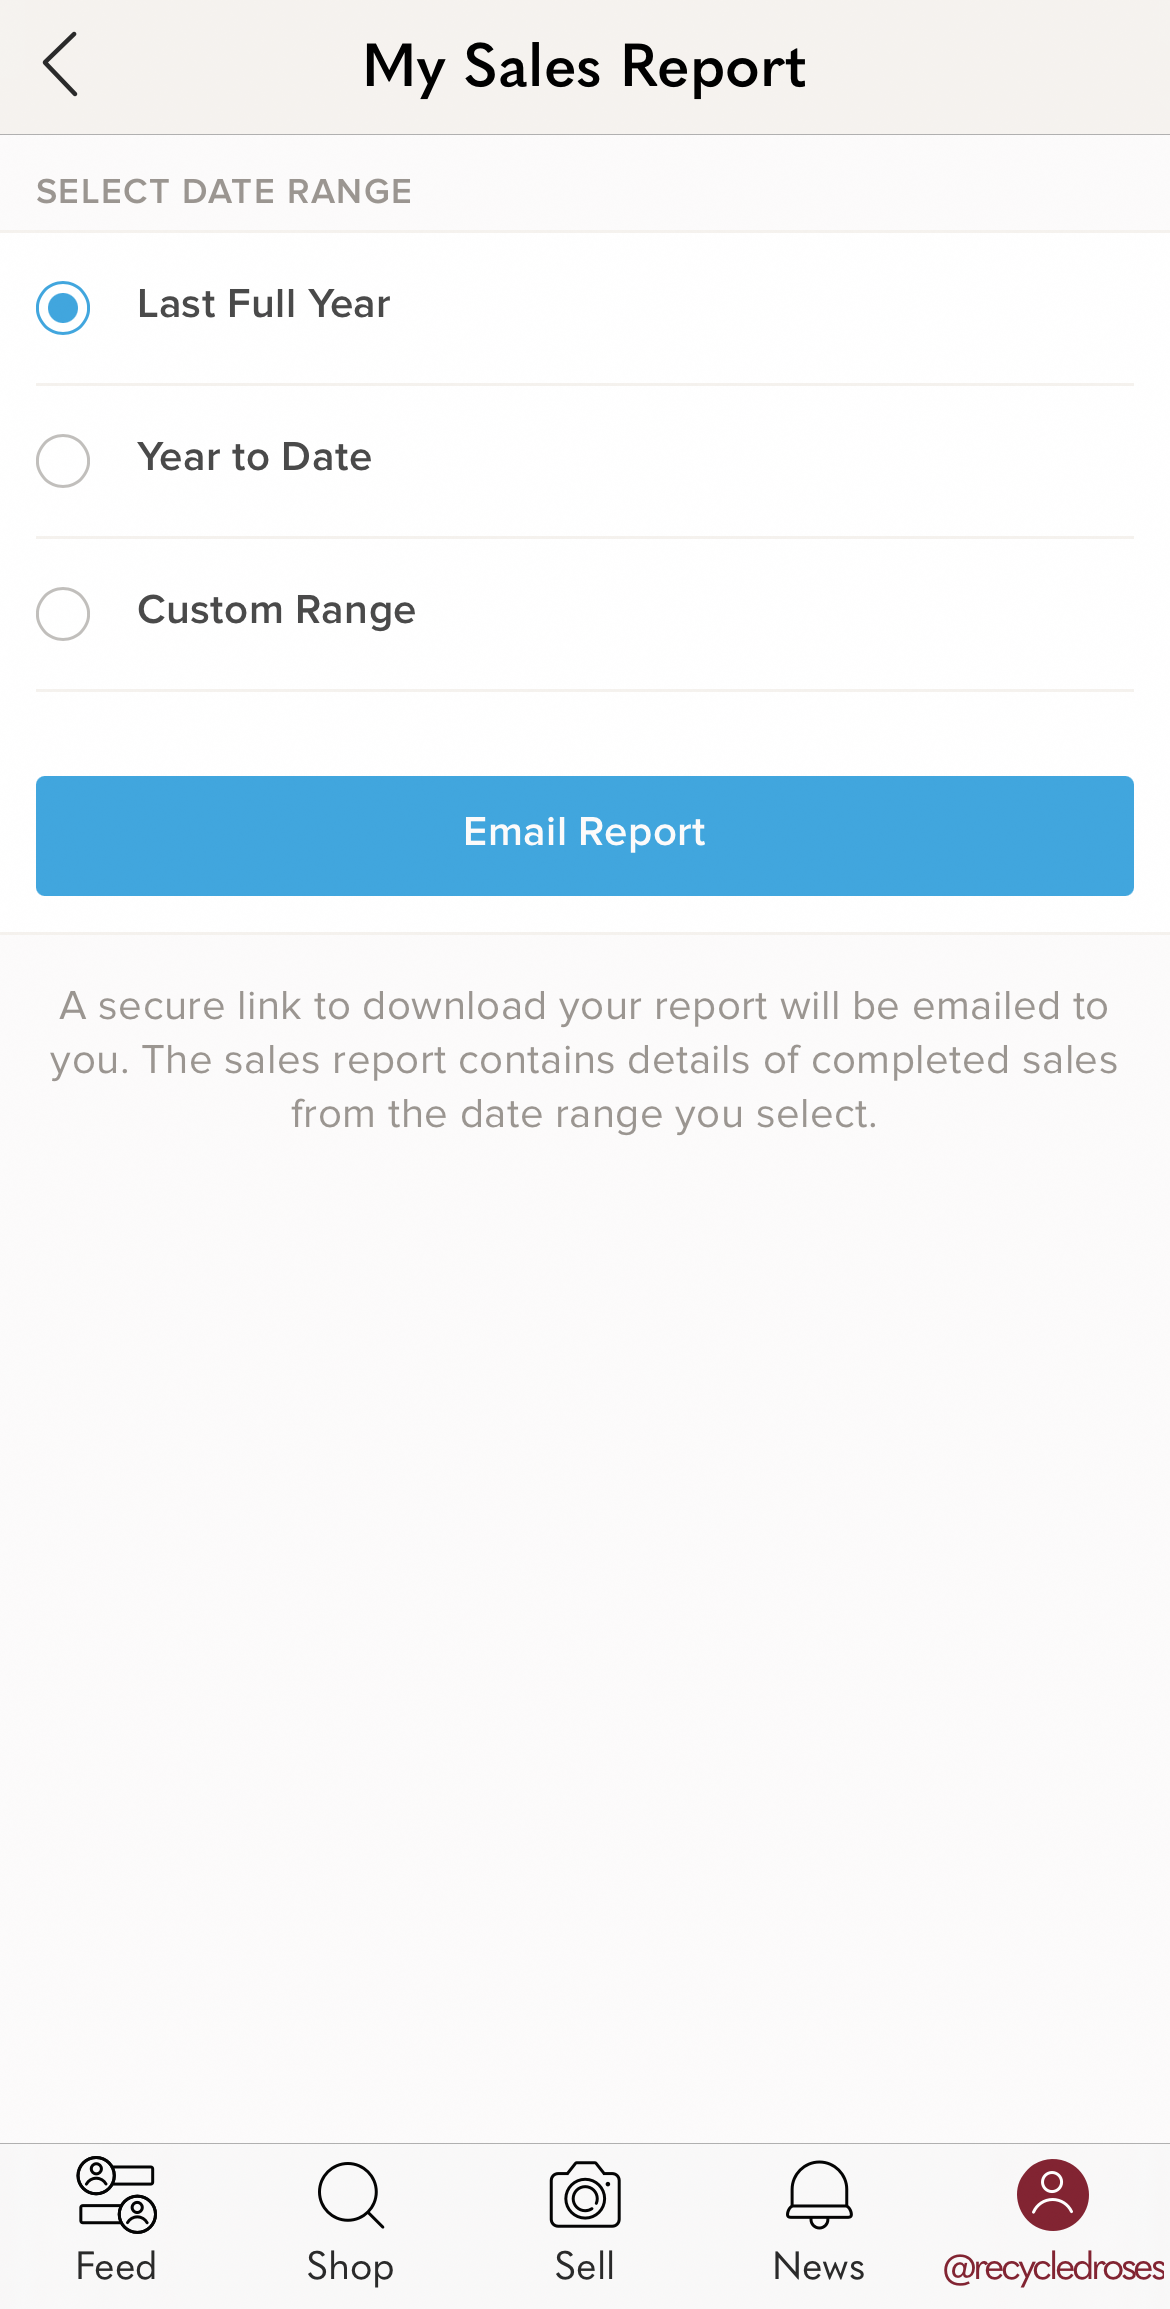
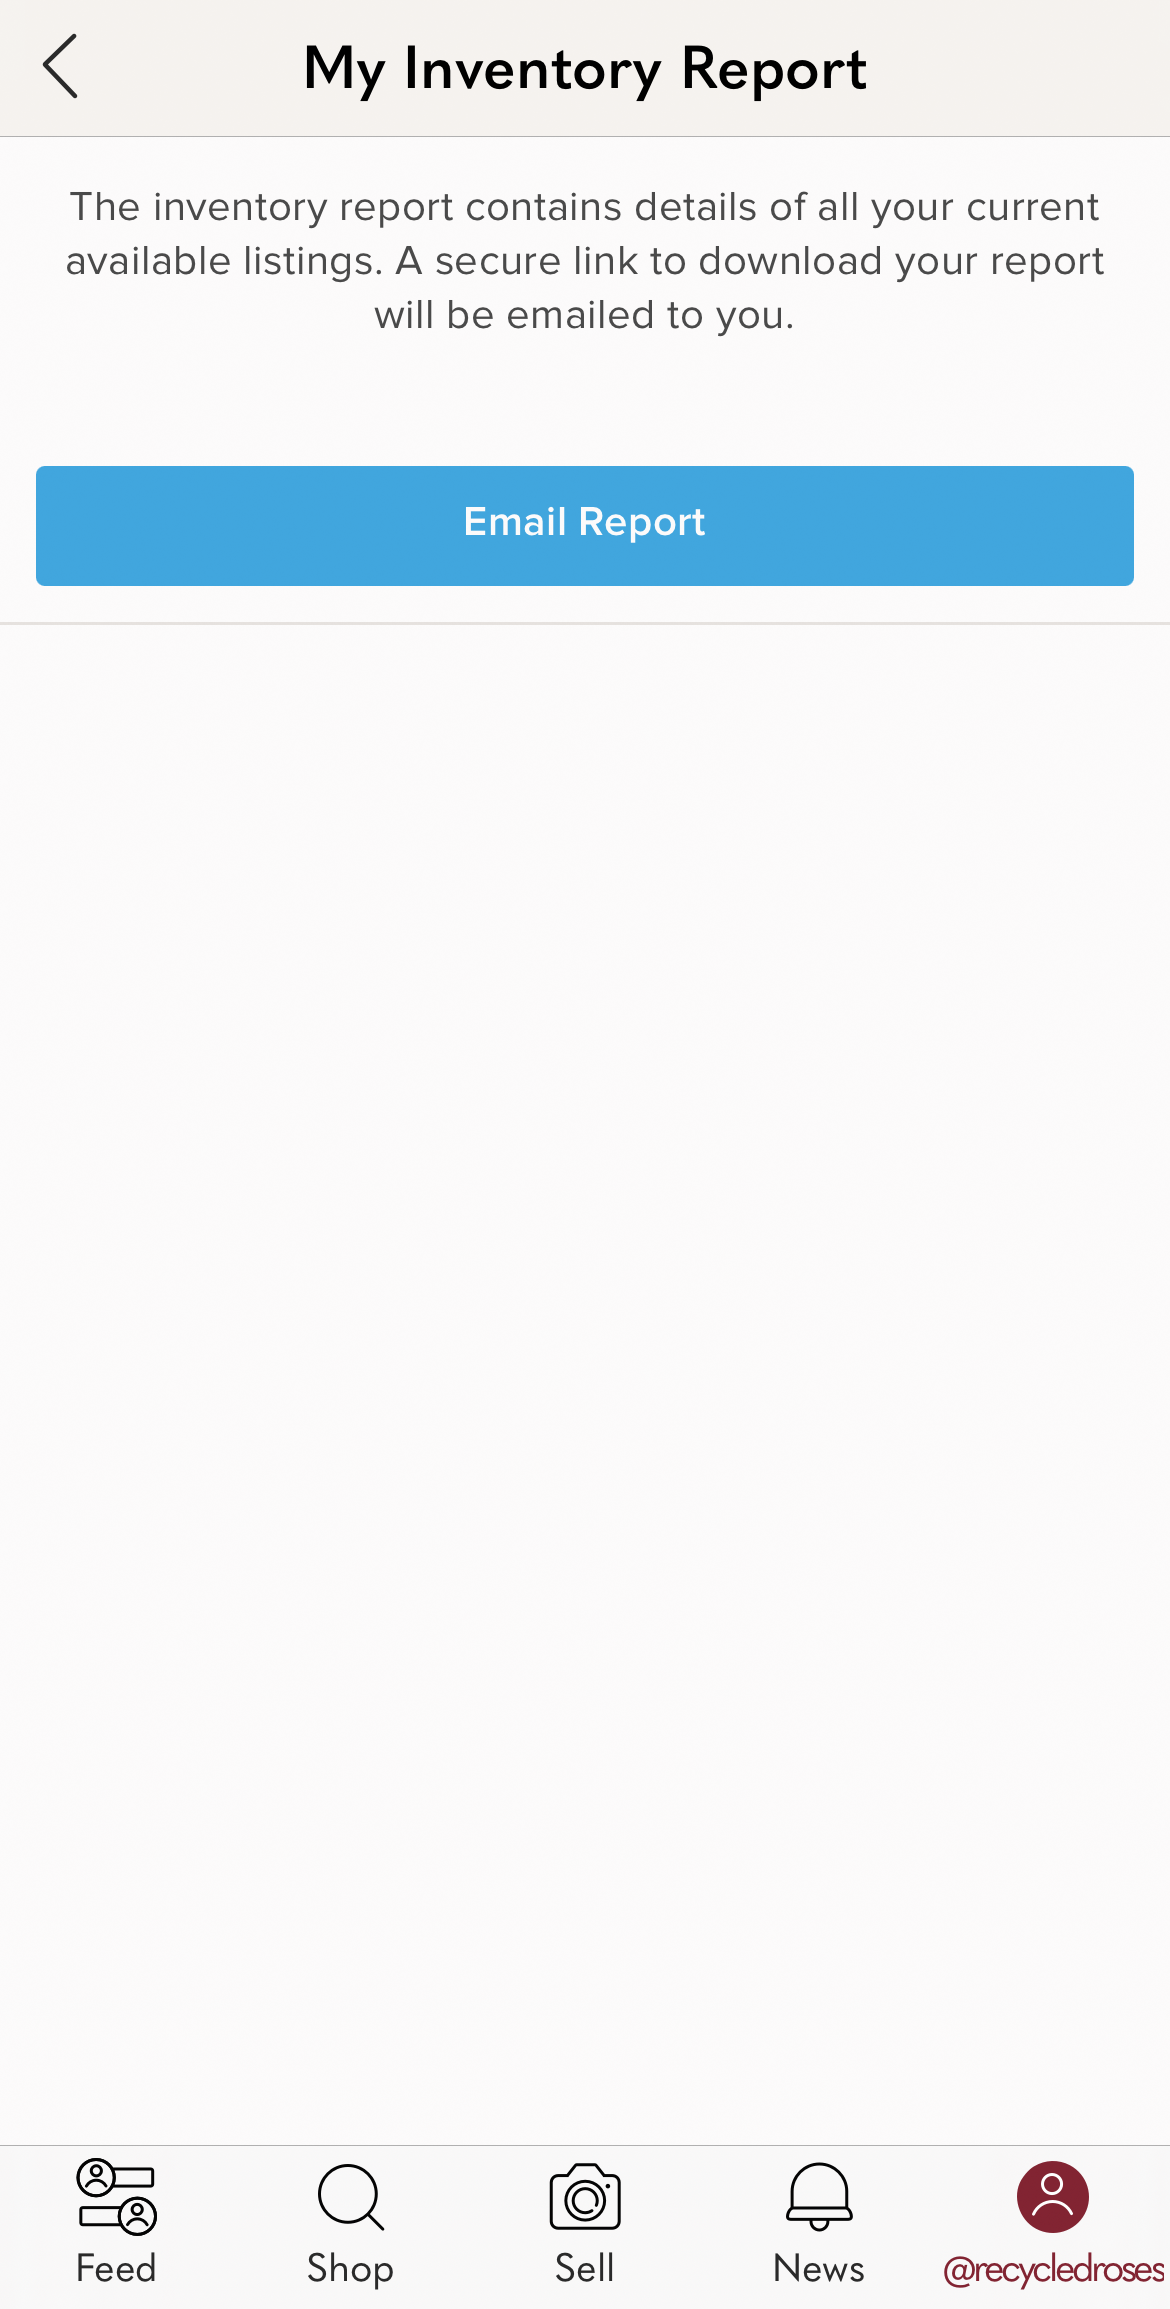
Click on My Seller Tools and then click on My Sales Report or My Inventory Report. Each of these links contains helpful information:
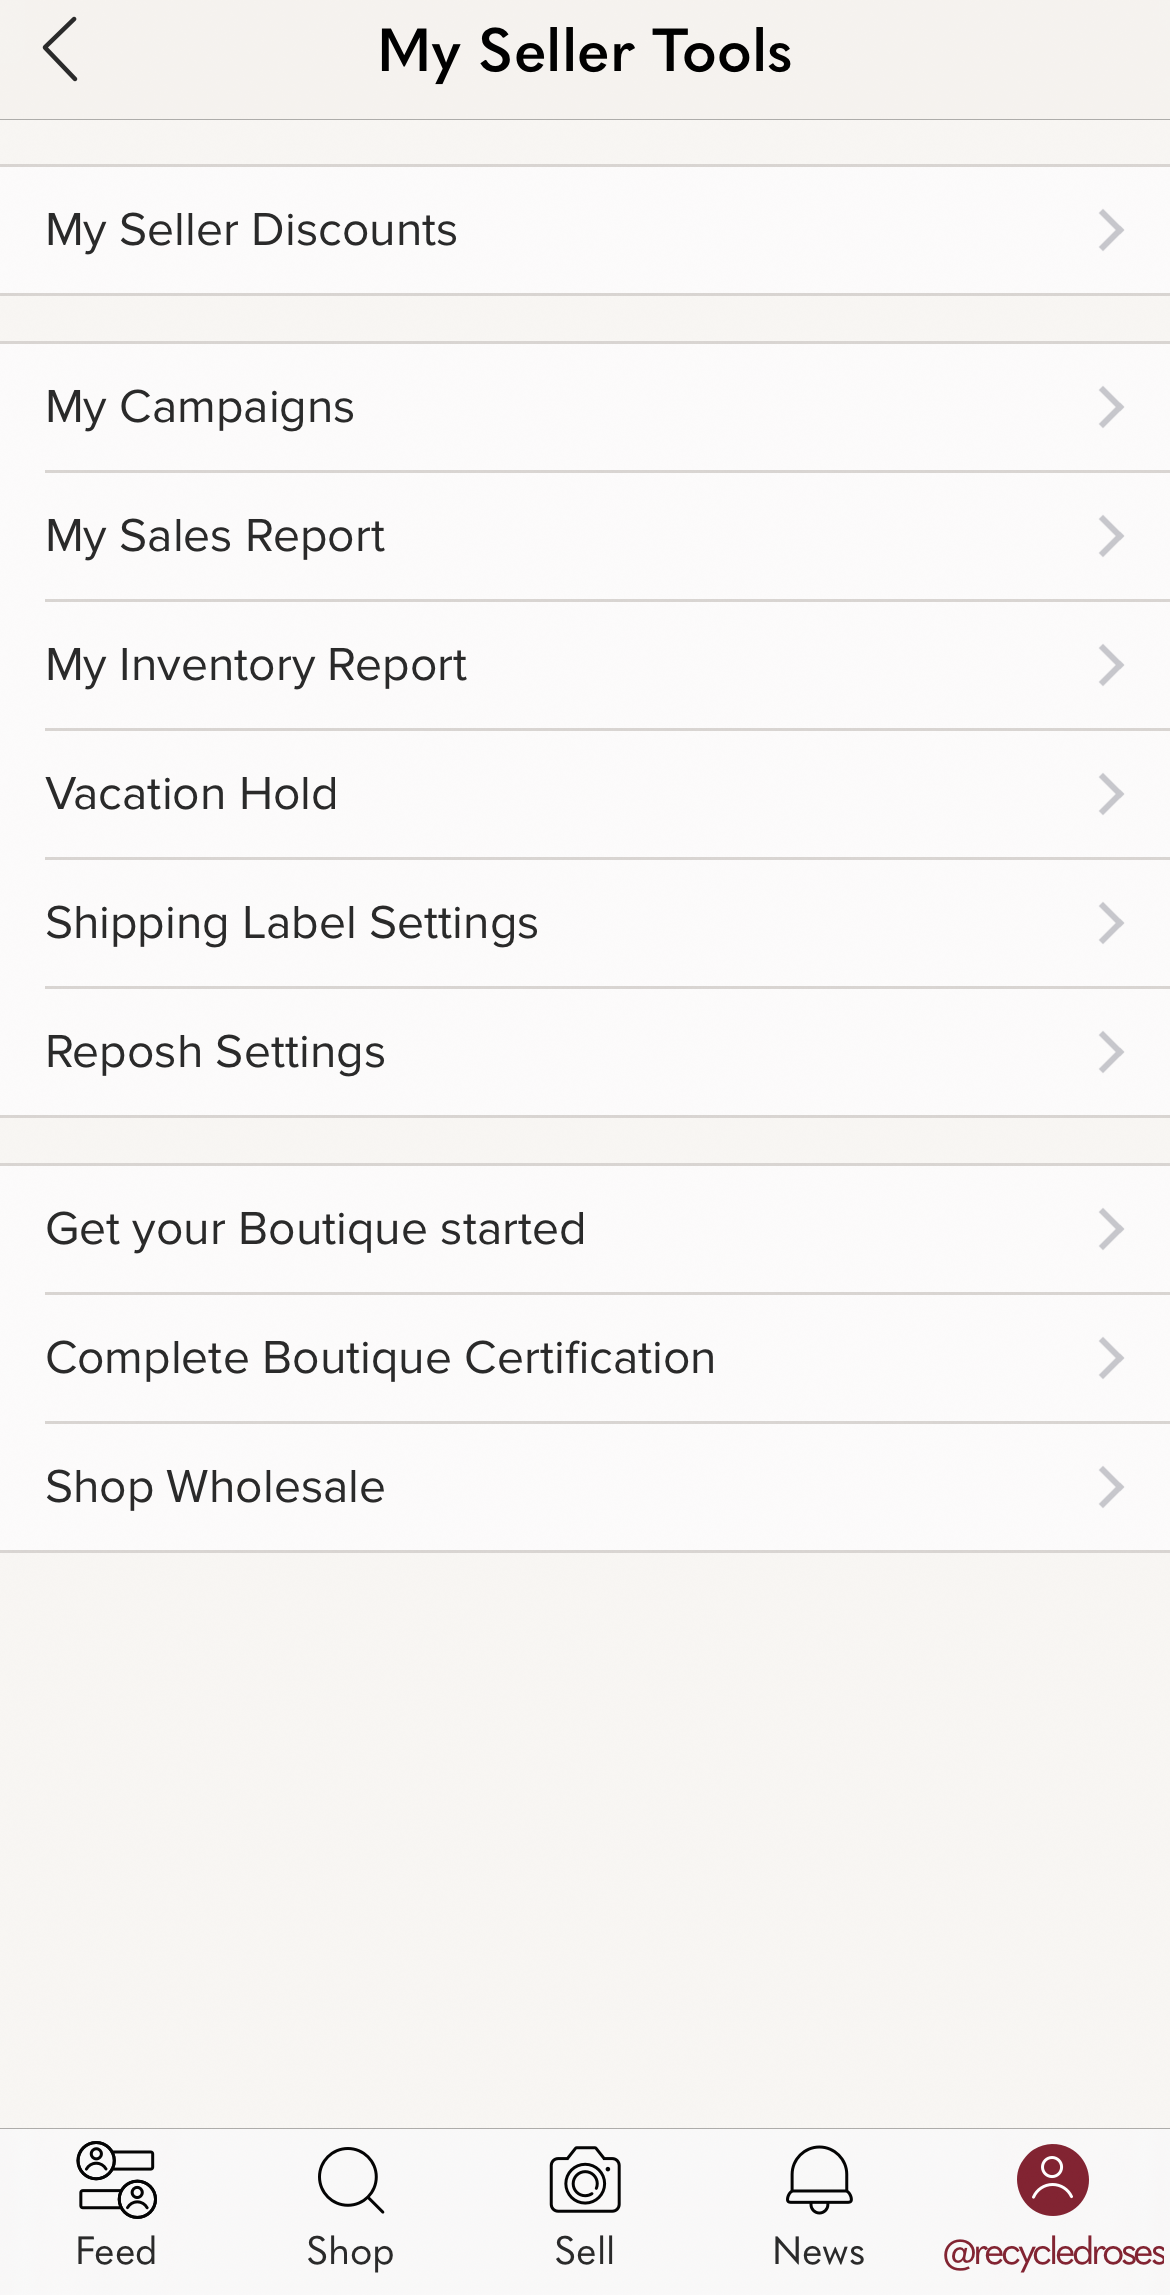
*When you click on My Sales Report, it will bring you to a screen where you can customize the dates for your requested sales.
*When you click on My Inventory Report, it will have a link for you to download all of your currently active listings.
The Free Mercari Sales Report:
To locate the Mercari Sales Report, the easiest way to find and download this report is through your computer. Be sure to be logged into your account as that is the only way that you can access it. This report is very similar to the Poshmark one but doesn’t provide as much detailed information.
To find this report, click on your profile icon on the top right hand corner. From there, a drop down menu should emerge. Scroll down until you find the Seller Dashboard.
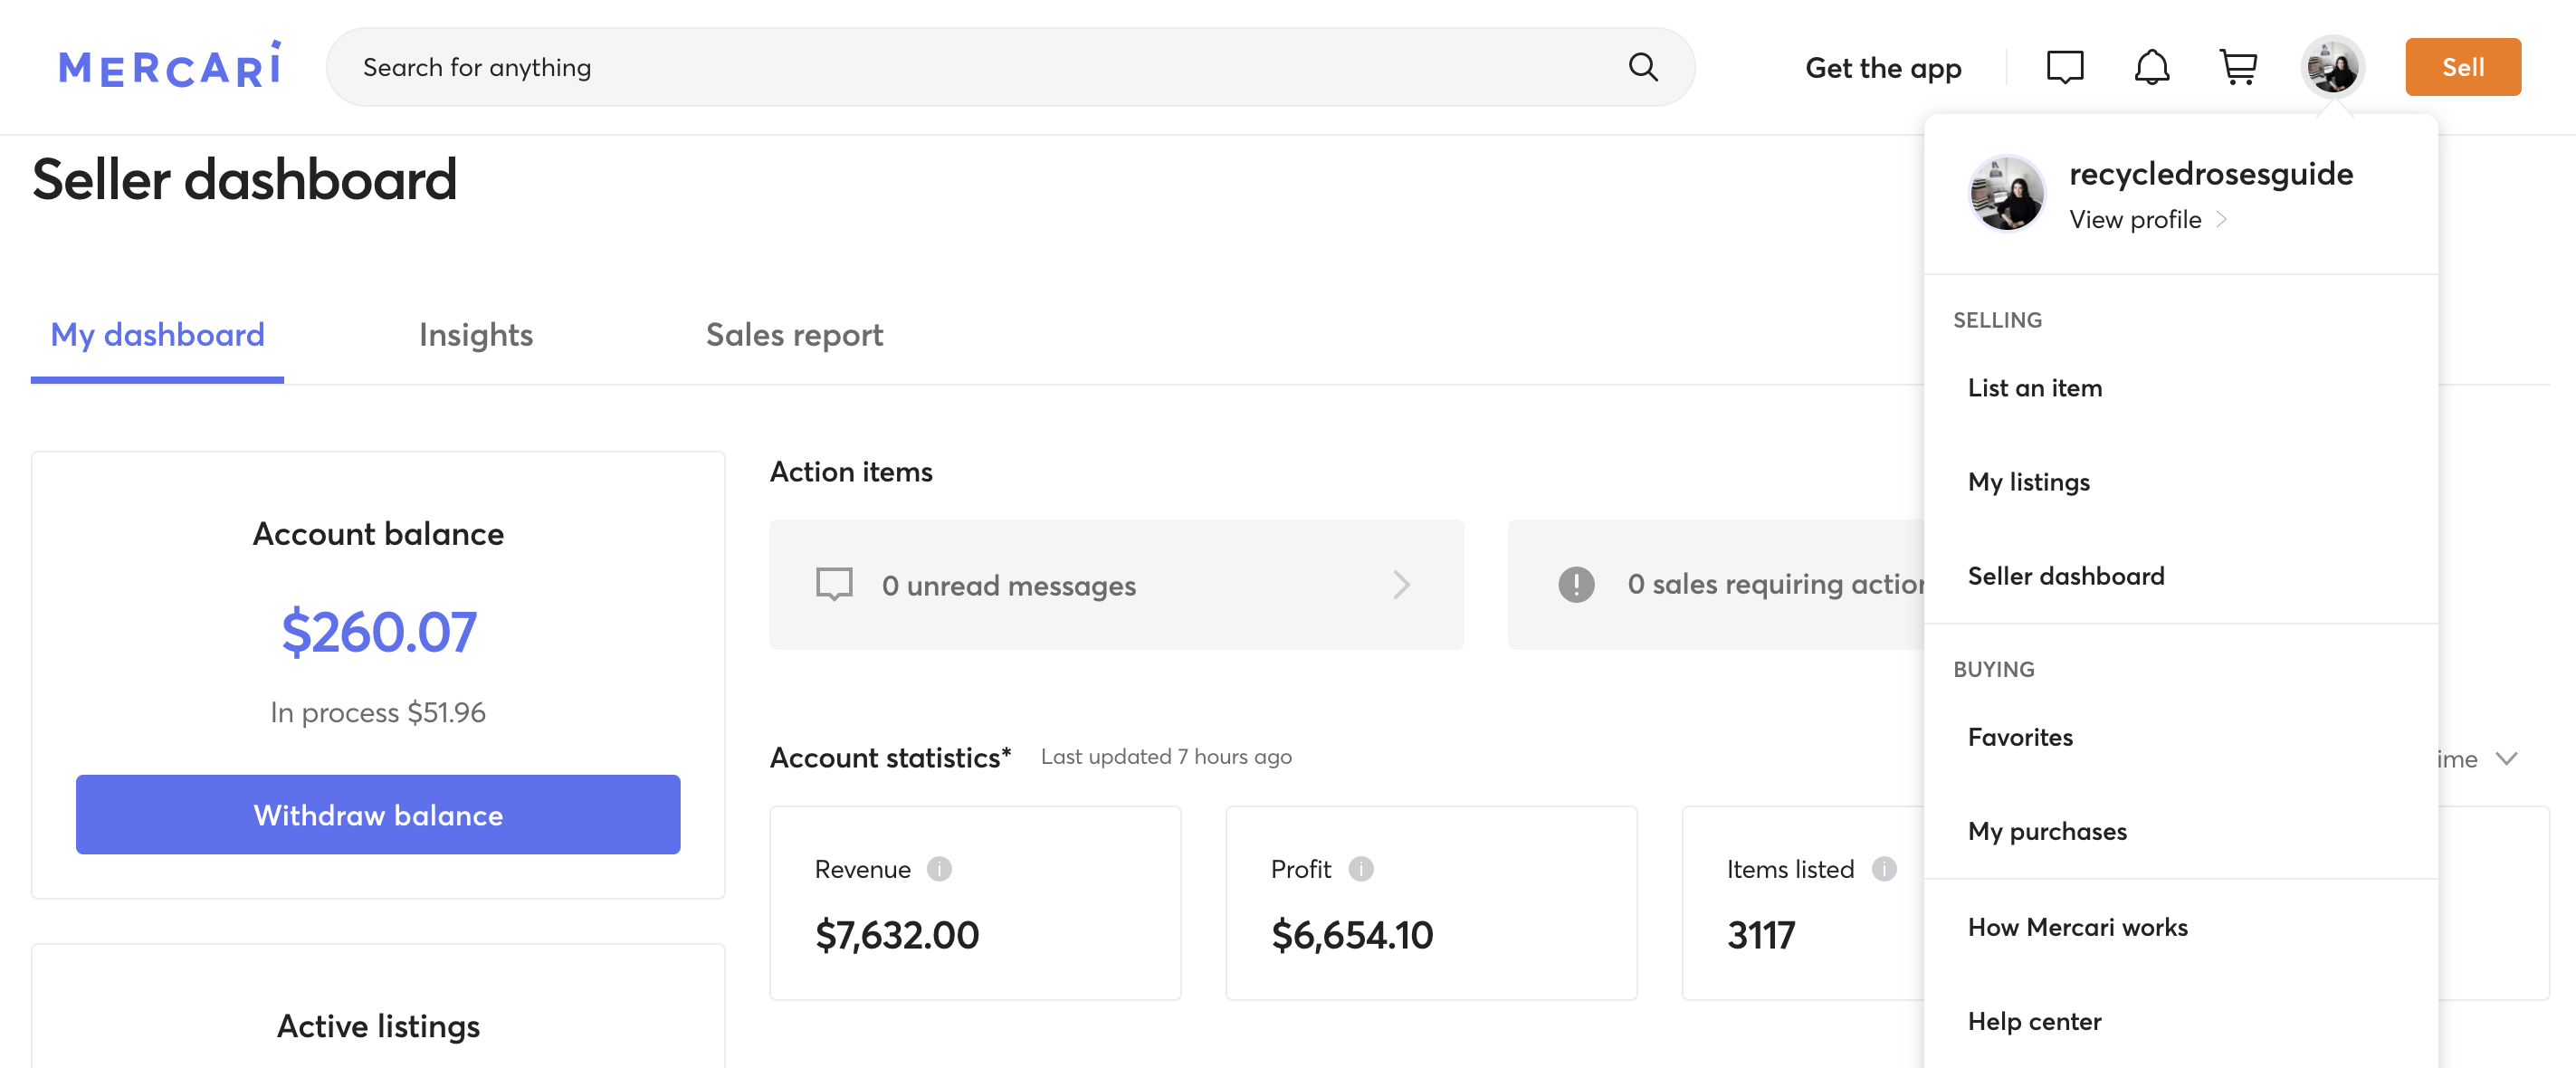
Once you click on the Seller Dashboard, another screen will generate with various data as seen below.
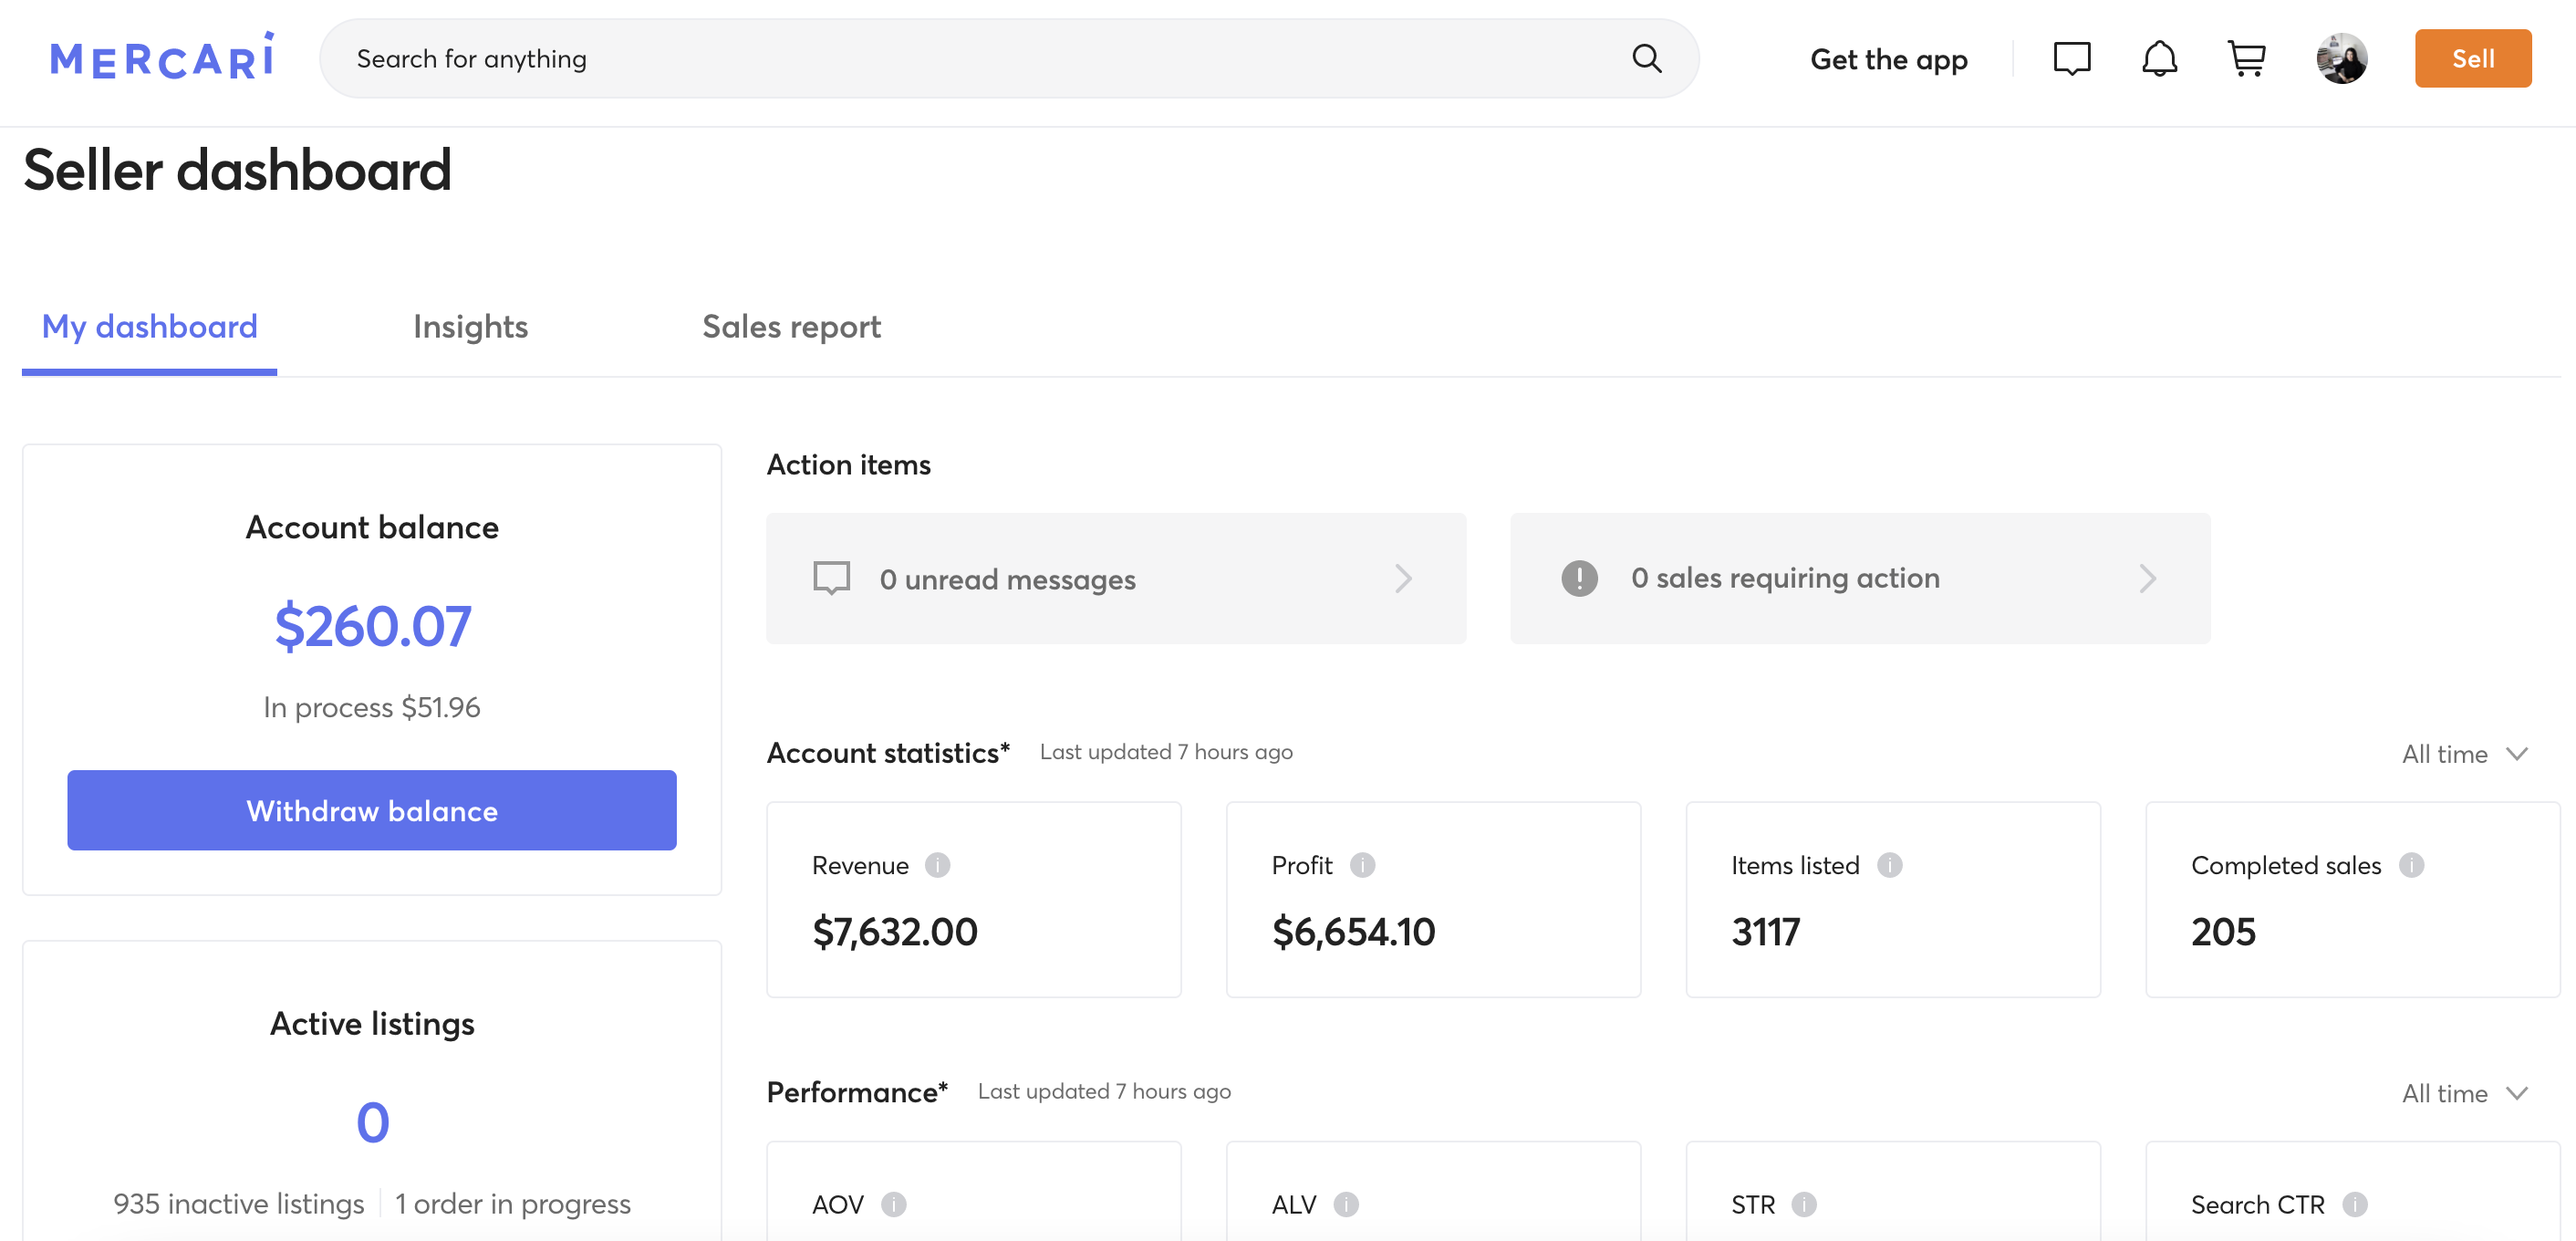
To access the Sales Report, click on the Sales Report tab within the Seller Dashboard.
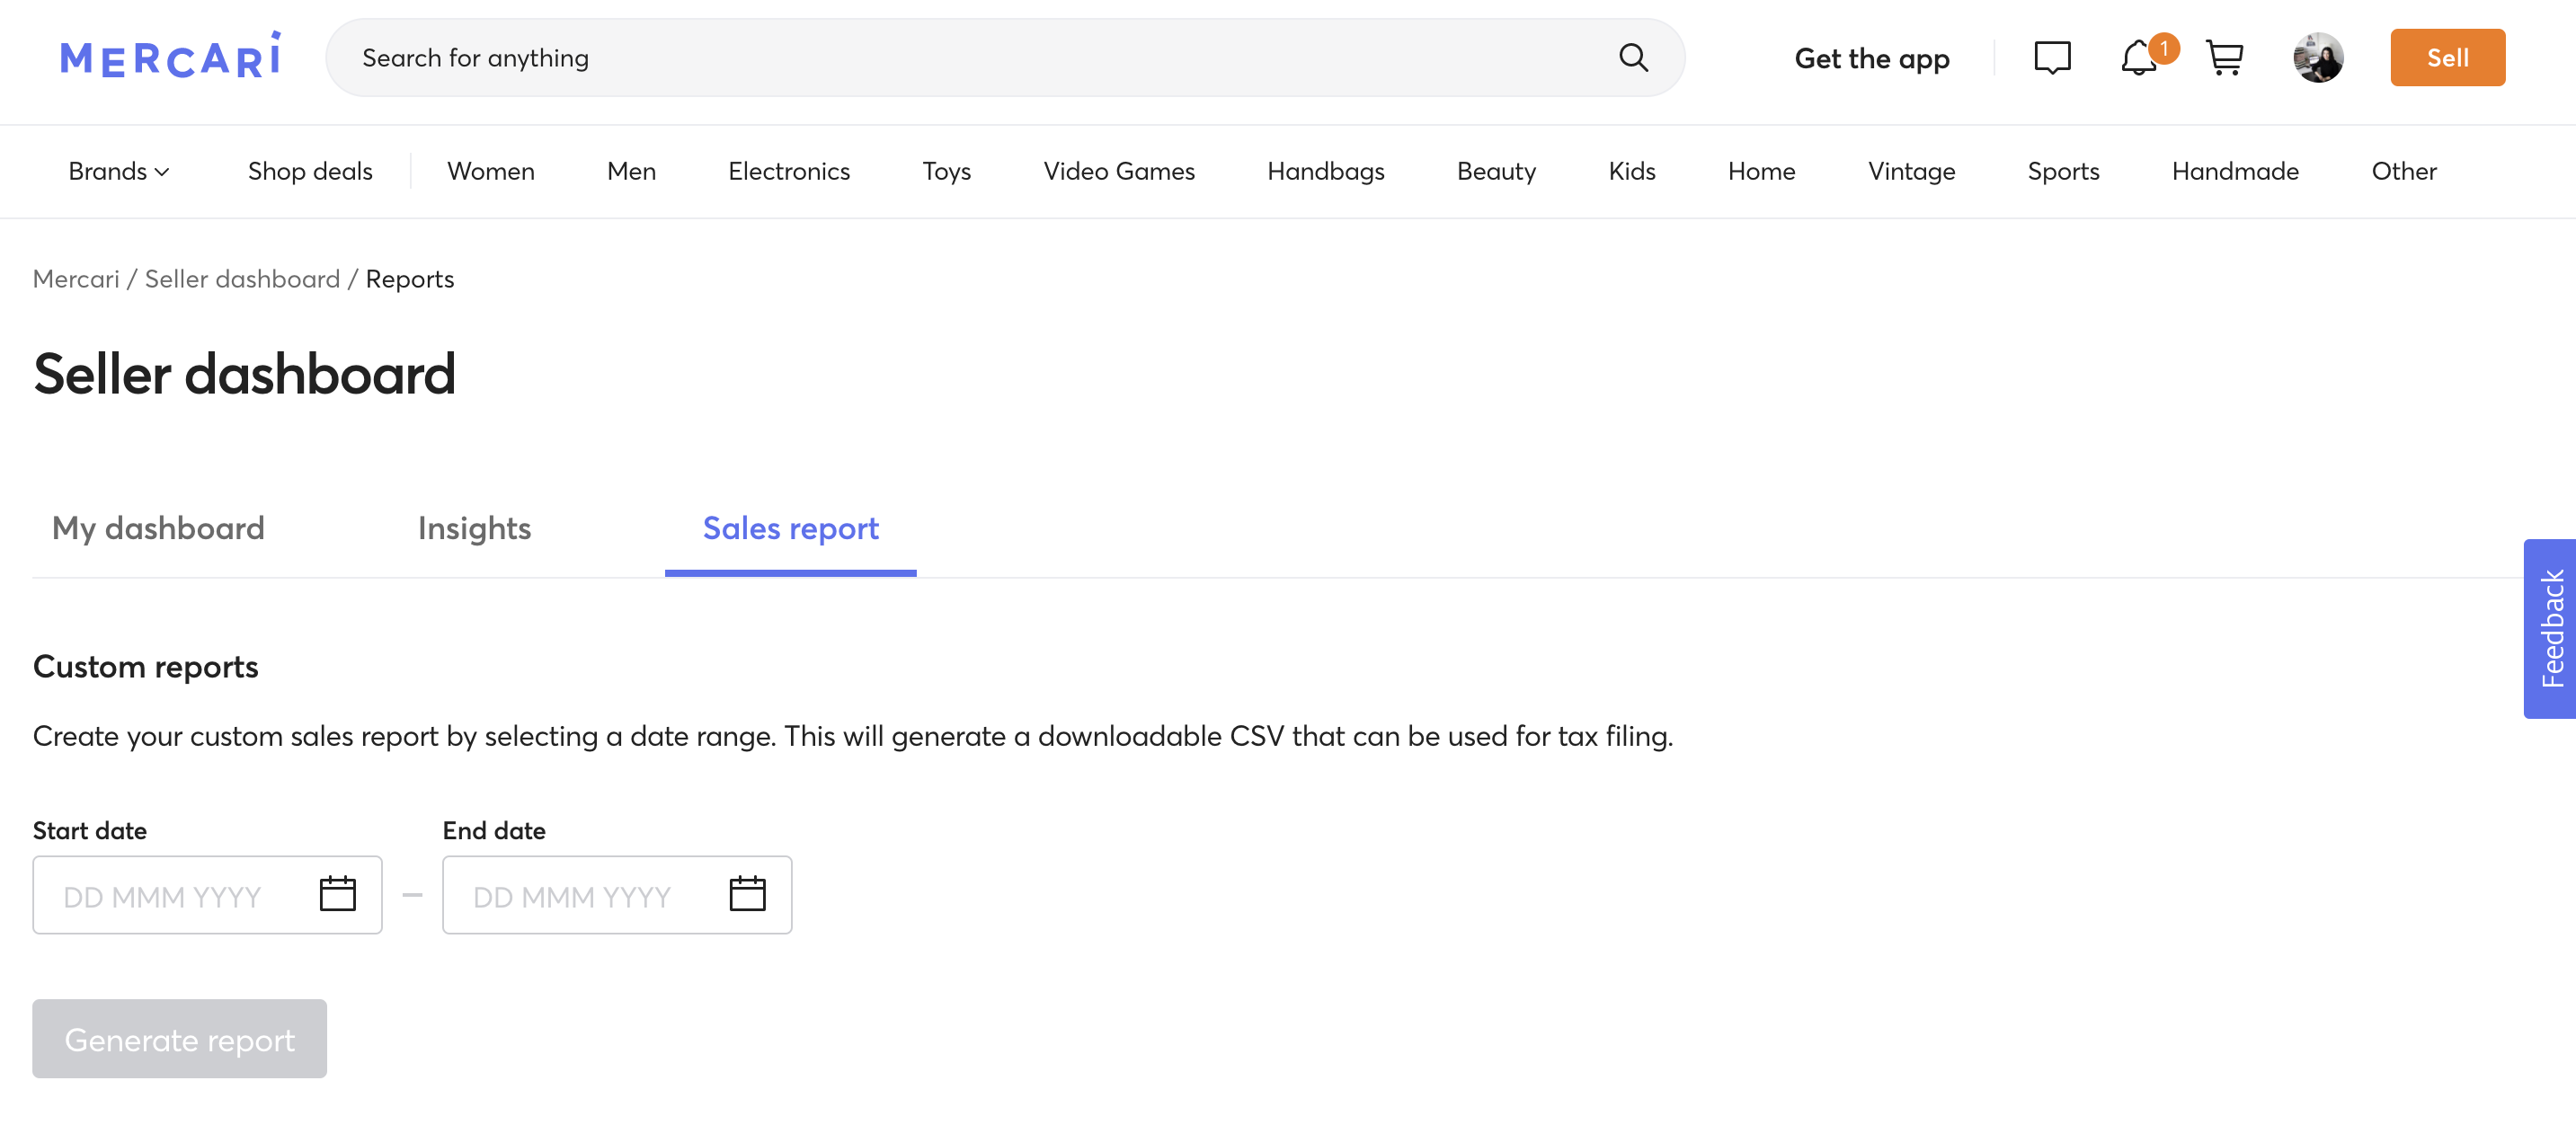
Lastly, fill in your data with the dates requested. A Sales Report will generate for you to download and save.
C) How to Interpret Your Data
Now that we’ve talked about how to find your data, let’s now talk about how to actually interpret it. When it comes to analyzing your data, there are few items that we really want to stop and take a look at. NOTE: Some items that I will be discussing below may require you to create or purchase an additional Excel/Google Sheet to keep track of it.
Basic Numbers
First and foremost, you can use this information to gain knowledge on basic business data. For example, you can use this data to gain insights on your monthly/yearly sales totals and profits. This data can also provide you with insight on your cost of goods, profit margins, and how long an item has been listed in your closet. To gain all of this data, you just need to plug in a few basic math equations and/or look for totals on the bottom of the report.
Demographic Data
These reports have limited insights on demographic data but they do have some. The Poshmark Sales Report provides you with a buyer’s zip code and state if you are curious. More importantly, this data is actually extremely helpful when you need to pay your state sales tax. Most states require you to pay sales tax on your Poshmark and Mercari sales. To learn more on that, visit your state’s tax website.
More Detailed Data
On the Poshmark Sales Report, you will notice that various item categories appear next to each sold item. These categories include tops, bottoms, dresses, etc and can be even further categorized into sub-categories such as short-sleeve tops and tanks. You can filter this data to see how many of each of these types of items sold within a given timeframe. Additionally, if you are interested in learning what brands are doing well for you, all you have to do is turn on a filter. This personalized data is extremely helpful when it comes to predicting consumer trends and sourcing data because it gives you insight on what people are purchasing at various times of the year.
If you are interested in purchasing a more detailed report, please check out these sheets below. I use them personally and they are great tools for gaining additional insights into your Poshmark closet:
**NOTE: For this week’s lesson, I will not be including an additional FREEBIE as this has a lot of FREE helpful info within it for you to check out!
If you don’t already, be sure to check out my Instagram for more Reselling Tips at @ RecycledRosesGuide (Click HERE) and my Facebook page HERE.
You can instantly shop all of my looks by following me on the LIKEtoKNOW.it shopping app HERE.
To get email notifications for my next blog post and to receive my monthly Reseller Recap (with freebies), sign up for my emails below:
Baci,


